 PDF Report (English)
タナ・トラジャの中山間地域の棚田とそれに関わる環境・文化・社会制度の研究 /棚田耕作者の生活に着目して
対象とする問題の概要 棚田とは山の斜面上や谷間の傾斜20度以上の斜面上に作られる水田のことを指す。棚田は平野が少ない中間山間地において、人々が食料を生産するために作り出した伝統的な農業形態である。しかし、棚田は一般的に耕地面積が狭い事や機…
Obesity is known to be closely associated with diet. A key objective of this study was to examine the relationship between the energy composition of the diets and the high prevalence of obesity in the area. Data were collected on the usual quantities of food consumed by study participants. The participants were observed in two seasons, for 7 days at a time. To turn this information into energy intake data, the study relied on a set of food composition tables by Hotz et al., (2012). However, these tables show only the energy composition of the flours but not of the food items that are prepared with the flours.
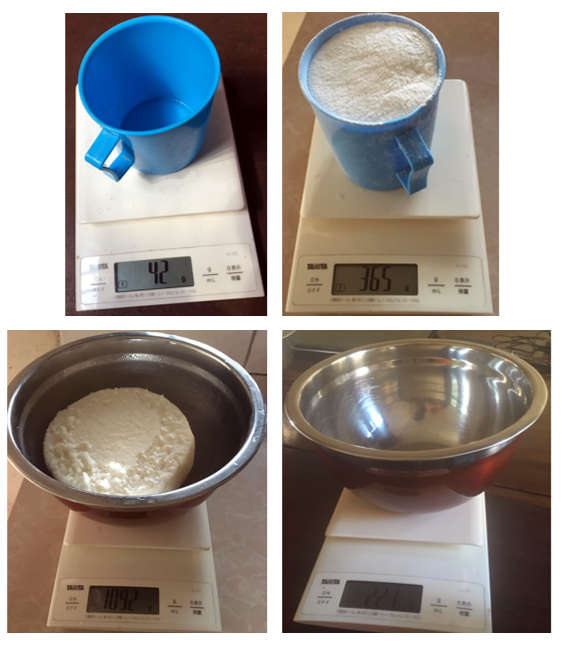
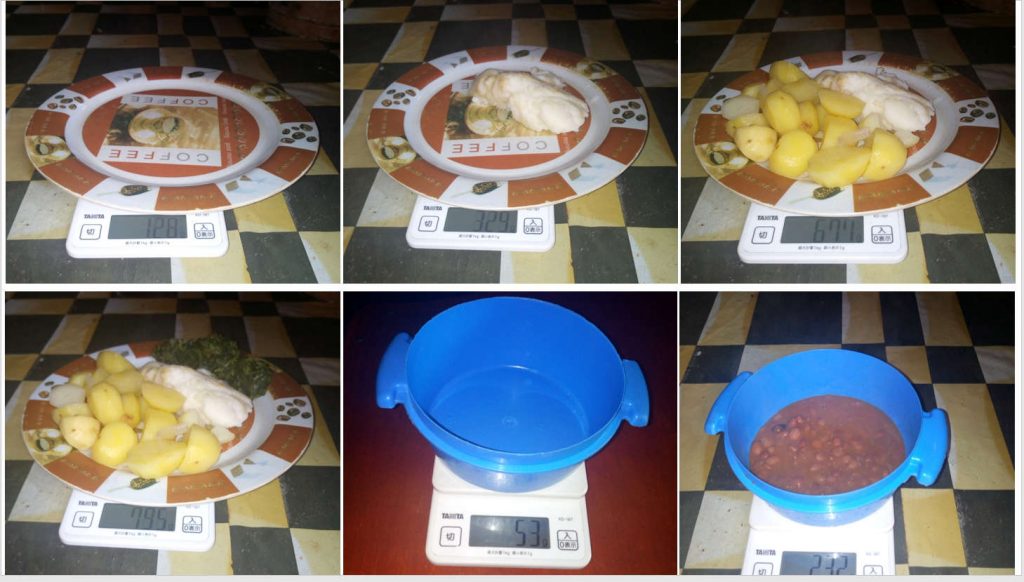
The aim of this study, therefore, was to estimate the amount of flour that is used to make a portion of a food item so that the energy composition per 100 g of the cooked food portion could be estimated from the value of that of 100 g of the flour, which appeared in the food composition tables developed by Hotz et al., (2012). To achieve this, one of the study participants was invited to measure and prepare the food items in the same way as she would at home, and the ratios were determined. This information was then used to determine the energy compositions of the participants’ diets.
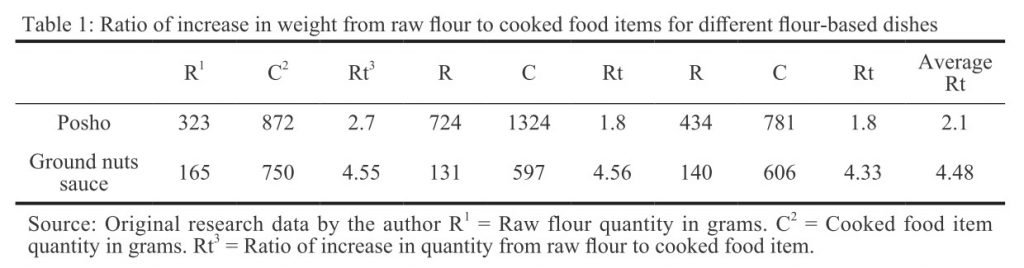
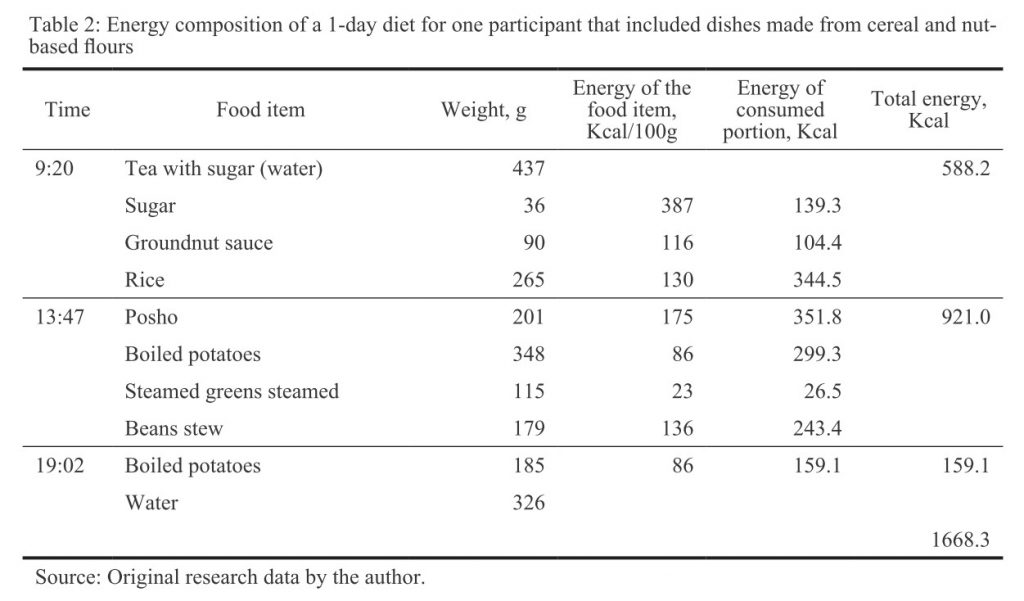
The energy composition of foods prepared with the flours and subsequently of the study participant’s diet, was estimated. For example, it was determined that 100 g of maize flour could produce approximately 210 g of posho (ratio 2.1) (Table 1). Therefore, if 100 g of maize flour contained 369 kcal (Hotz et al., 2012), then so did 210 g of posho. If 210 g of posho contained 369 kcal, then 100 g of posho contained 369/210*100=175 kcal. This combined with the measured weight of posho eaten could be used to determine the participant’s energy intake from posho (Table 2).
I will use similar ‘experiments’ to estimate the energy and nutrient composition per 100 g of dishes comprised of several ingredients, such as groundnut sauce mixed with silver fish.
【1】Hotz, C., Abdelrahman, L., Sison, C., Moursi, M., & Loechl, C. (2012). A Food Composition Table for Central and Eastern Uganda. http://r4d.dfid.gov.uk/Output/188904/Default.aspx. Accessed on October 21, 2019.
Copyright © 附属次世代型アジア・アフリカ教育研究センター All Rights Reserved.